FIRN Data Visualisation For NZ Businesses | © 2026 FIRN
We’ve worked with data long enough to see the same pattern play out in all sorts of businesses: strong goals, sensible priorities, and a genuine desire to make better decisions, held back by data that isn’t quite structured, trusted, or accessible enough to support them properly. The issue usually isn’t a lack of ambition. It’s a lack of clarity around what the data needs to do and what needs to be in place to make it useful.
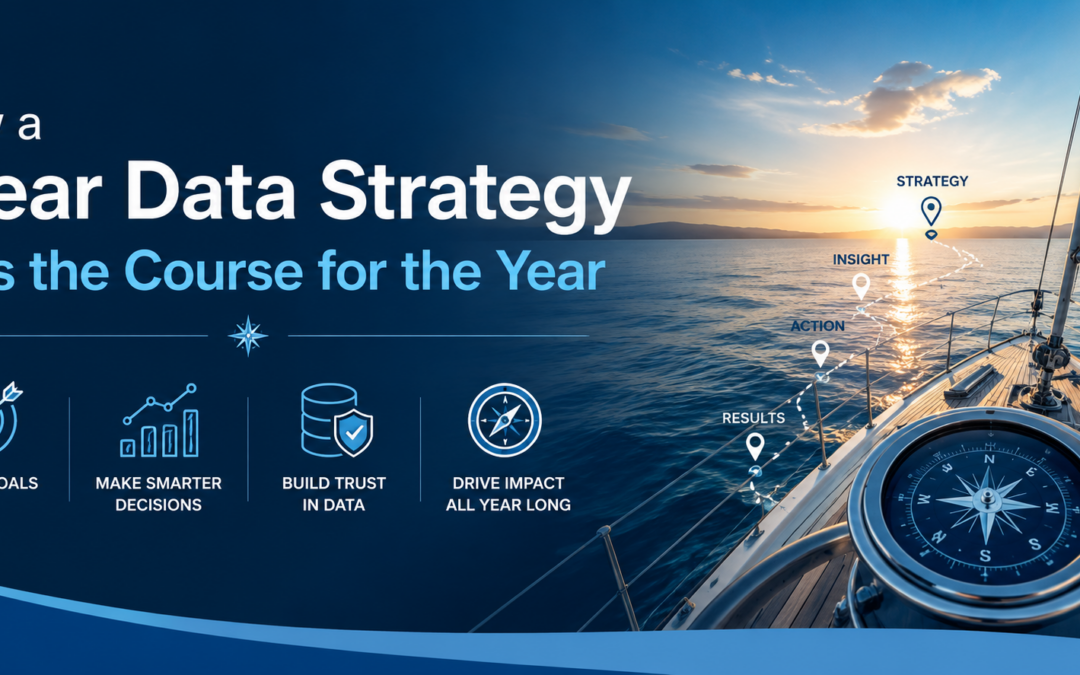
That’s why we’ve put together this outline for a clearer data strategy. It’s designed to help businesses think more practically about what to prioritise, what to fix first, and how to create a data environment that supports the rest of the year more effectively.
Start With The Foundations: Can Your Data Support The Plan?
Before a business starts improving dashboards or asking more of its reporting, it needs to know whether the underlying data is in good enough shape to support that work. If information is still scattered across systems, pulled together manually, or stored in ways that make consistency difficult, any strategy built on top of it is going to feel harder than it should.
That’s why the first step we recommend is usually quite simple: check the foundations. Look at where data lives, how easily it can be accessed, and whether the current setup is giving teams a reliable view of the business. For some organisations, that means tidying existing processes. For others, it means putting stronger data warehousing in place so reporting and analysis aren’t built on a shaky base.
Month 1–2: Align The Strategy With Business Priorities
Once the foundations are set, the next step is deciding what the data actually needs to help the business do. If the year is focused on growth, efficiency, customer retention, forecasting, or cost control, the data strategy should be built around those goals from the start.
This is the point where it helps to ask specific, clarifying questions. What decisions will leadership need to make regularly this year? Which metrics really matter? Where is the current reporting slowing people down or leaving too much open to interpretation? Done properly, this stage creates a much clearer sense of direction across a team. It also helps prevent businesses from spending time on reporting that looks impressive but doesn’t actually support the decisions that matter most.
Some businesses really benefit from data consultancy at this time. Bringing in an experienced outside perspective can highlight blind spots early, sense-check the plan, and stop your business from investing in the wrong fix. That might mean holding off on software you don’t actually need yet, or avoiding training and processes that will only create more confusion later. Getting clearer advice at this stage usually makes the rest of the strategy much easier to follow through on.
Month 2–3: Sort Out Trust Before Scaling Reporting
Once priorities are clear, the next step is dealing with the things that make the data difficult to trust. If definitions vary across teams, ownership is vague, duplicate records keep creeping in, or access is handled inconsistently, reporting will only go so far before people start questioning it.
At this point, data governance is often well worth reviewing. Tightening up ownership, definitions, access, and data quality can remove a surprising amount of friction early on. Reporting becomes easier to rely on, teams spend less time second-guessing the numbers, and decisions tend to move along with a lot less back-and-forth.

Month 3-6 Improve Reporting
Once the data is in better shape, reporting becomes far more useful. This is usually the point where businesses can give teams clearer visibility, faster answers, and a much easier way to track what’s going on.
The real test is whether people can use the reporting without needing half a meeting to explain it. Strong business intelligence and clear data visualisation help people spot issues, follow performance, and make decisions with less back-and-forth. For businesses working in Microsoft environments, we often recommend getting more familiar with Power BI, as it’s a great way to help sharpen the structure, logic, and usability of reporting that already exists.
Month 6-10: Move From Hindsight to Action
By this stage, your analytics should be helping your business act earlier. A useful way to sense-check that is to look at whether you can:
- Track trends over time rather than rely on one-off monthly snapshots.
- Compare performance across products, teams, regions, channels, or customer groups.
- Spot unusual changes early enough to investigate them before they become bigger issues.
- Identify recurring bottlenecks, delays, or drop-off points in operations or customer journeys
- Separate leading indicators from lagging ones, so you are not waiting until the end of the month to see that something is off.
- Give decision-makers something clear enough to act on without needing extra explanation every time.
If those pieces still aren’t in place, this is often where stronger data analytics can make a real difference. At this stage, the goal is usually to go beyond surface-level reporting and start understanding why performance is shifting, where inefficiencies are building, and which signals are worth acting on earlier. Done well, analytics gives your business a clearer basis for decisions over the rest of the year.
End The Year With A Review
By the end of the year, your business should be able to review the strategy against real changes. That might mean checking whether reporting is faster, whether teams trust the numbers more easily, whether manual work has been reduced, and whether decisions are being made with less back-and-forth.
That gives you a much clearer basis for what comes next. Instead of rolling the same gaps into another planning cycle, you can see where further work will have the most value, whether that sits in governance, reporting, analytics, or the underlying data setup.
Build a Clearer Data Strategy with FIRN
The strongest data strategies are the ones that still make sense once the year gets busy. They give your business a clearer framework for what to fix first, what to build on, and how to keep data useful as priorities shift.
We’ve worked with businesses at all sorts of stages, whether they need help shaping the plan, improving what’s already in place, or getting past a point that’s holding everything else up. If your strategy feels solid in some areas and stuck in others, reach out to our team at FIRN. We’d love to help you work out the next step.
Data Strategy FAQs
Do you always need new tools to improve a data strategy?
Not at all. Sometimes the issue is less about tooling and more about structure, ownership, reporting logic, or how well the existing setup is working.
How often should a data strategy be reviewed?
At the very least, it should be reviewed as priorities shift throughout the year. If reporting is slowing decisions down or teams are losing confidence in the data, it’s probably time.
What usually causes a data strategy to lose momentum?
Most often, it’s a gap between the plan and the day-to-day reality. Priorities change, reporting stays clunky, or the underlying data isn’t reliable enough to support what the business needs.
Can a data strategy fail even when the reporting looks good?
Yes. Reporting can look polished and still be built on inconsistent definitions, shaky ownership, or metrics that don’t really support the decisions your business is trying to make. A strategy holds up much better when the logic underneath the reporting is just as strong as the front end.